
Tracking My 2025 Park Visits: An Orlando Local's Year in Review


At the start of 2022, I decided to embark on a project for the new year. I created a spreadsheet to track every one of my park visits for the entire year. Being a local in Orlando, that resulted in a very long, very extensive spreadsheet, complete with every attraction I experienced for the entire year as well.
Having started in 2022, I now have four full years of Orlando local theme park attendance data. Now, while I consider myself to be the average theme park fan, I do have a job that requires me to visit the parks so my statistics may not exactly be reflective of the typical Central Florida resident.
With all of that being said, I once again want to acknowledge that I am incredibly fortunate to be able to experience these parks on a regular basis and in no way do I take that for granted (as you may see from these numbers).
So, let's take a look at my 2025 theme park visits.

Total Park Visits
While last year's numbers trended down in the last few months due to my wife and I becoming parents, this year was mostly down across the board for... well, the same reason. Obviously, I was not able to visit the parks in 2025 quite as much as I was in 2023 or even most of 2024.
With that being said, my total park visits were down from 102 in 2024 to 92 in 2025. This was my first year not reaching at least 100 park visits since I began tracking this data in 2022.
Park hopping played a big role in this dip as well, as I visited parks on 82 unique dates this year. This was up from last year's 79 unique dates, and yet my overall park visits were down. 89% of the times I visited a park in 2025, I visited only one park. That's the highest that metric has been in four year, and up considerably from 77% in 2024.
Those 82 unique dates also mean I visited a theme park once every roughly 4.5 days in the past year, which is of course more frequent than the 4.6 days in 2024. However, it is still considerably less frequent than once every 3.8 days in 2023.
And before we get into the parks I visited most often, I of course need to acknowledge the fact that Orlando got a massive new theme park in 2025. Universal Epic Universe officially opened in May and I did visit multiple times. While that did impact this year's numbers, it likely won't sway them too significantly until Universal Orlando offers annual passes to the new park. At which point, you can expect Epic Universe to consistently be at the top of the following list...
But until then, the park I visited most in 2025 was...
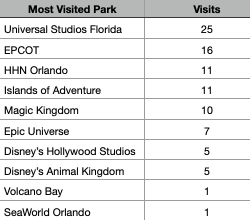
Universal Studios Florida

No surprise here as this is the fourth straight year Universal Studios Florida tops the list. The same factors were at play here. This park's proximity to my home combined with its frequent special events like Mardi Gras and the Holiday Celebration, make it a strong candidate to be my most visited every year for the rest of my life. And in 2025, it topped the list with 25 visits, nine more than my second most visited park. As always, this does not include visits for Halloween Horror Nights, as that was counted as a completely separate park.
In the year of its opening, I visited Epic Universe a total of seven times in 2025. Four of those visits came in previews, before the park officially opened. Those seven visits were enough to make Epic Universe my sixth most visited park, beating out both Disney's Hollywood Studios and Disney's Animal Kingdom. In fact, seven visits is more than I've had to Animal Kingdom in any year since I've started tracking.
Some other findings include the ending of, what we'll call the EPCOT anomaly of 2024. From 2022 through 2024, I somehow managed to coincidentally visit EPCOT exactly 17 times each year.2025 saw that streak end as I visited the park 16 times, which is eerily close to keeping the streak alive. And this truly is coincidence because I had totally forgotten about this streak until I sat down to write up this report. Had I known sooner, I likely would have made an effort to keep the streak going.
Outside of Halloween Horror Nights (which we'll dive into more deeply in a bit), visits to every other park were either down or the same. SeaWorld Orlando was the only park that remained the same, with one visit this year. Magic Kingdom was down from 17 to 10, Hollywood Studios down from seven to five, Animal Kingdom down from six to five and Islands of Adventure down from 17 to 11. Even my 25 visits to Universal Studios was down from 28 the prior year.
This was also the second year in a row I visited only 10 parks, after having visits 15 the two years prior. And while this year figured to include one more because of the opening of Epic Universe, it instead only served as a replacement for my 2024 visit to Hong Kong Disneyland.
Another thing I have been keeping tabs on in the past few years is my visits to Walt Disney World vs. Universal Orlando Resort. While the gap between the two shrunk to just five park visits last year (52-47 in favor of Universal) the pendulum swung back and my visits favored Universal over Disney by a 55-36 margin. That gap of 19 park visits is still fewer than the 24 in 2023. However, while I set a new high for Walt Disney World park visits in 2024 with 47, my 36 visits this year is a new low for my four-year span of tracking this data. And again, Epic Universe certainly played a big role in this shift back to Universal.
Here is the complete list of parks I visited in 2025:
Attractions
Just like in years past, I found most of my park visits do not include actually experiencing an attraction. I enjoy the vibe of the park but don’t necessarily feel the need to wait to jump on my favorite ride. Typically, If the wait time is short, that’s when I take advantage.
And while my attractions per visit was up from an even one to 1.24 this year, that number was still down from both 2023 (1.62) and 2022 (1.66). This was, however, the first time that number has seen an increase.
42 of my 92 parks visits in 2025 did not include experiencing an attraction of any kind. And while my overall number of visits is lower than years past, that is only 46% of my visits that saw me not experience an attraction, the lowest in four years.
Once again, the end of the year greatly impacts these numbers as I tend to skip the attractions in the month of December. 2024 saw a streak of 14 straight park visits without an attraction to close out the year. 2025 continued that trend, with 10 straight such visits. However, that stretch was not quite as extreme this year, as I did experience multiple attractions throughout the month of November. Something I did not accomplish in 2024.
As always, I want to clarify that for this study, I classified attractions as anything that required me to enter an existing queue. Nighttime spectaculars and some other shows and experiences that could easily be entered at any time, were excluded (example: Journey of Water, Inspired by Moana).
With that being said, my most experienced attraction of 2025 was…
Monsters Unchained: The Frankenstein Experiment

It's always exciting when a new attraction opens up. And obviously, it's even more exciting when a whole new park full of incredible new attractions opens up. And while I experienced just about every attraction at Epic Universe multiple times, only one could take the top spot. Monsters Unchained is without a doubt my favorite attraction in that park and one of my favorites in any park, so it did not surprise me in the slightest to see it atop this list. Plus, I suppose due to the subject matter of this attraction, the wait time is typically much shorter that you might anticipate.
It is interesting though that seven appears to be the new magic number. After Men in Black: Alien Attack, the Walt Disney World Railroad and the TTA PeopleMover tied atop 2024's list with seven experiences each, Monsters Unchained topped this year's list with that same number.
Here are my top 14 most experienced attractions in 2025:
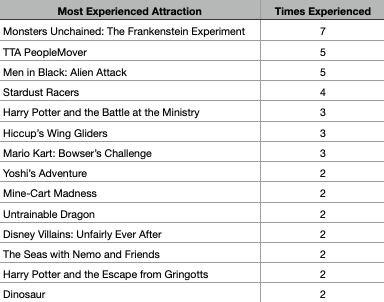
This list of 14 attractions includes every attraction I experienced more than once in 2025. Unsurprisingly, you can see several other Epic Universe attractions sprinkled throughout this list, including Stardust Racers, Harry Potter and the Battle at the Ministry, Hiccup's Wing Gliders, Mario Kart: Bowser's Challenge, Yoshi's Adventure, Mine-Cart Madness and The Untrainable Dragon.
You'll also see two of last year's most experience attractions near the top of the list. Men in Black and the PeopleMover nearly stole the show again, but came up just a bit short, while the Walt Disney World Railroad fell off the list entirely. This isn't all that surprising though as I have experienced both Men in Black and the PeopleMover at least four times each year since 2022, while the Railroad had never made the list prior to 2024.
There are, however, a couple of attractions that are surprisingly absent from this list. I experienced Universal Orlando's Horror Make-Up Show five times in 2024 and yet not a single time in 2025. Also, The Haunted Mansion, which I consider to be one of my favorite attractions anywhere, didn't make the cut as I only experienced it once in 2025.
Unsurprisingly, Epic Universe saw the highest rate of attractions per visit (APV) at 4.1. Halloween Horror Nights, which is also typically high in that statistic, was second with an APV of 3.8. Magic Kingdom followed with a 1.1.
2025 also saw a slight increase in unique attractions experienced, jumping from 47 in 2024 to 53. While that number is trending up, it is still down considerably from 66 in 2023 and 95 in 2022. The most attractions I experienced in a single day (Halloween Horror Nights excluded) was nine, which came at Epic Universe. It all adds up to 114 total attractions experienced in 2025.
Obviously, I did not get a chance to experience all of my favorite attractions in 2025. Some of the notable attractions I did not experience even once in the past year include TRON Lightcycle / Run, Guardians of the Galaxy: Cosmic Rewind, The Tower of Terror, Star Wars: Rise of the Resistance, Space Mountain and The Incredible Hulk Coaster. And while I broke the streak and experienced Avatar: Flight of Passage for the first time since at least 2021, it has now been at least a full four years since I have experienced Kilimanjaro Safaris. Will that streak be broken in 2026?
Halloween Events

For the second consecutive year, Halloween Horror Nights Orlando is the only Halloween event I experienced. However, I was able to attend HHN a bit more than the year prior. I attended HHN Orlando 11 times in 2025, compared to just seven times in 2024. However, that 11 times is still down from 19 in 2023 and 13 in 2022. That 2023 number stands out because it was the only year I purchased Express Pass for the duration of the event. All of the numbers for that year are greatly impacted by Express.
Here are the numbers on my HHN Orlando runs:

This year's event featured a very strong lineup of 10 haunted houses. The two standouts for me were The Horrors of the Wyatt Sicks and El Artista: A Spanish Haunting, which topped the list with nine and six experiences respectively. Five Nights at Freddy's and Terrifier were experienced less because of their consistently long wait times.
Interestingly, my number of runs through IP houses vs. original houses was almost completely even, with 21 runs through IP houses to 20 for originals. Overall, those 41 house runs (plus one experience of the Nightmare Fuel stage show) added up to a big increase from just 27 HHN attractions the year prior. However, my APV for this year's event was actually down from 3.9 to 3.8, due to my limited number of visits in 2024.
Some More Numbers
And just because I’m a statistics nerd (in case you haven’t already figured that out), I wanted to end with some other interesting stats and facts from my past year of park visits.
First park of the year: Universal Studios Florida
First attraction of the year: Men in Black: Alien Attack
Final park of the year: EPCOT
Final attraction of the year: Elmo's Choo Choo Train (SeaWorld Orlando)
Most park visits in a month: 13 (August)
Fewest park visits in a month: 3 (April - Tied for fewest in four years of tracking)
Most unique park visit days in a month: 12 (August)
Longest stretch of days without a park visit: 19 (March - April)
Most attractions in a month: 34 (October)
Fewest attractions in a month: 0 (December - second straight year without an attraction in December)
Most attractions in a single day: 10 (HHN - two occasions)
Most attractions in a single park in a single day: 10 (HHN)
Obviously, experiencing the parks as often as I have in the past year is a lot of fun, but I also enjoyed tracking my experiences. I guess we’ll have to see how different these numbers will be in 2026.